TCFD REPORT 2022
The purpose of this report is to disclose how we assess and manage the exposure of our clients’ investments to climate-related risks and opportunities, as well as our strategic resilience to climate risks.
Polunin Capital Partners Limited (“PCPL”, “Polunin”, “the Firm”) is pleased to publish its first Task Force on Climate-related Financial Disclosure (“TCFD”) Report, for the year ended 31 Dec 2022.
Whilst not in scope of the UK FCA ESG 2.1 Rule which requires regulated firms to publish TCFD-aligned climate disclosures, the Firm has produced its first TCFD report in support of the disclosure. The information enclosed therefore is provided on a best-efforts basis.
The Firm only invests in Emerging Market and Frontier Market equity securities, and all climate analysis on our assets under management (“AUM”) refers to this asset class. Polunin uses Institutional Shareholder Services (“ISS’) climate data as input for climate scenario analysis.
In line with TCFD’s recommendations, this report comprises of 4 sections:
1. Governance
Disclose the organisation’s governance around climate related risks and opportunities
The PCPL Board of Directors has oversight of the company’s strategy and investment objectives and has ultimate responsibility for management of climate and sustainability-related risks and opportunities within the strategic focus of our operations. This report, and our 2022 financed emissions metrics and climate risks analysis have been reviewed by the Board.
Our responsible investment methodology, policy and reporting are overseen by the ESG & Sanctions Screening (‘ESGSS’) Committee, which is chaired by our CIO, with 7 members from the investment, compliance and client service teams. The ESGSS Committee meets monthly to review the responsible investment policy development, including monitoring transition, litigation, and physical risk, and other relevant sustainability risks.
The Committee also sets the engagement priorities related to managing portfolio-related climate risks. The compliance team is responsible for oversight of stewardship activities, ensuring that independence is maintained, and proxy voting guidelines are aligned with our approach to sustainability. Compliance monitors and ensures that investment processes and products comply with regulations and investment management agreements. Compliance matters are formally reviewed every three months by the Compliance Committee, which includes four members of senior management.
The minutes from meetings of the ESGSS Committee and Compliance Committee are presented for review and discussion at the Firm’s quarterly Board meetings.
2. Strategy
Disclose the actual and potential impacts of climate-related risks and opportunities on the organisation’s businesses, strategy, and financial planning, where such information is material
Material climate-related risks can be split into:
Transition risks – arise from policy, legal, technology and market changes as part of climate change mitigation, and transition to a low carbon economy. Transition could result in increased capital expenditures, increased stranded asset risk, and decreased demand for certain goods and services that affect value of portfolio companies. Shifts in regulation and investment preferences may pose varying financial and reputational risks to organisations.
Physical risks – arise from more frequent and acute (event-driven) disruptions such cyclones, floods, wildfires, heat wave and droughts, and chronic (longer-term) gradual impacts such as higher average temperatures, sea level rises, and spread of vector-borne diseases. Effects can include property damage, supply chain disruption, and increased operating costs.
We have identified ways in which climate risks and opportunities could impact portfolio companies:
|
RISK |
DESCRIPTION |
TIMEFRAME1 |
IMPACT ON PORTFOLIO COMPANIES |
PORTFOLIO RISK MEASUREMENT TOOLS |
| Physical: Acute | Risks from increased severity of extreme weather events, including cyclones, floods, wildfires, heat waves and droughts | Long-term | Increased write-offs, capital costs, and insurance premiums due to physical asset damage; decreased revenues due to supply chain disruptions | Climate Value-at-Risk (CVaR) |
| Physical: Chronic | Risks from increased variability in weather patterns, including precipitation and rising mean temperatures; and rising sea levels | Long-term | Increased operating costs from variable weather patterns and temperatures; decreased revenues due to lower output/ disruptions; increased insurance premiums in high-risk locations | CVaR |
| Transition: Policy | Risks from climate transition regulation that can affect a company’s direct operations, suppliers, or customers | Short, medium, and long-term | Stranded asset risk; increased operating costs | CVaR |
| Transition: Technology | Risks from failing to create or transition to new low carbon emissions technologies | Short, medium, and long-term | Stranded asset risk; decreased demand for products and services | CVaR, IEA and OECM sector carbon budget alignment pathway |
| Transition: Market | Risks from changing consumer behaviour, increased costs of raw materials and uncertain market signals | Short, medium, and long-term | Decreased demand for goods and services due to shift in consumer preferences; increased production costs due to higher input prices and waste treatment costs | IEA and OECM sector carbon budget alignment pathway |
| Transition: Reputation | Risks from negative stakeholder feedback, and stigmatisation of sector | Short, medium, and long-term | Decreased demand for goods and services; decreased revenue from workforce attraction/ retention issue; decreased capital availability | Controversy screens |
| 1. Short-term: 1 year, medium-term: 2-5 years, long-term: >5 years. | ||||
Climate change also brings about change in market returns and business models, as well as creates opportunities as we transition from carbon-intensive to renewable driven industries.
|
OPPORTUNITY |
DESCRIPTION |
TIMEFRAME1 |
IMPACT ON PORTFOLIO COMPANIES |
PORTFOLIO RISK MEASUREMENT TOOLS |
| Resource Efficiency | Opportunities from efficiency in use of water and raw materials | Long-term | Reduced operating costs | Engagement reporting |
| Energy Source | Opportunities from use of lower emissions sources, supportive policy incentives and new technologies | Short, medium, and long-term | Reduced operating costs, decreased sensitivity to energy prices | IEA and OECM sector carbon budget alignment pathway |
| Products & Services, Resilience | Opportunities from development of climate mitigation and adaptation solutions | Short, medium, and long-term | Increased revenue through demand for climate mitigation and adaptation solutions, increased reliability of supply chain | CVaR |
| Markets | Access to new markets, use of public-sector initiatives | Short, medium, and long-term | Increased revenues due to access to subsidies and tax credits | Engagement reporting |
Climate scenario analysis
As of 31 Dec 2022, the transition Climate Value at Risk (“CVaR”) of our total AUM, based on the IEA’s Net Zero 2050 scenario, is estimated to be 29%.
Currently 22% of the portfolio companies by value have committed or approved Science Based Targets (“SBT”), 25% have set a reduction target, whilst the remaining 52% do not have a carbon reduction target.
The sector-level attribution of the transition CVaR is estimated as follows:
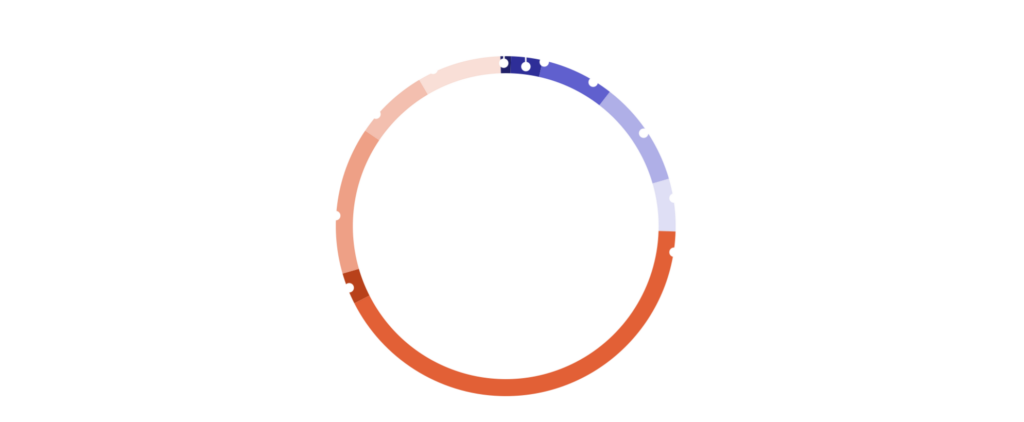
Figure 1: N.B. ISS estimates
Physical Climate Value at Risk (CVaR) of the most likely scenario (RCP 4.5) and the worst-case scenario (RCP 8.5) are estimated as:
|
|
PROJECTION OF AVERAGE RISE FROM 2081 TO 2100 |
PHYSICAL CVAR |
|
| Scenario | in temperature | in sea-level | all AUM |
| RCP 4.5 | 2.4C | 0.59cm | 3.6% |
| RCP 8.5 | 4.5C | 0.89cm | 5.4% |
N.B. ISS estimates, using their proprietary EVA model on property, plant & equipment, including rented and leased PP&E (operational risk) and revenue (market risk) impacts by location. The analysis covers hazards including tropical cyclones, coastal and river floods, wildfires, heatwaves, and droughts.
3. Risk Management
Disclose how the organization identifies, assesses, and manages climate-related risks
Engagement plays the biggest part in our approach as many emerging markets companies are still at an early stage of disclosing their environmental risks and management approach. Noting the transition CvaR reflects the large number of emerging market companies who do not have carbon reduction targets, we are asking all our portfolio companies to implement the following in a 4-year time frame:
- Start publicly reporting on environmental impact such as greenhouse gas (“GHG”) emissions, water usage, waste generation etc;
- Set targets on absolute emission reduction (in particular interim targets over 2026-35) and report on progress;
- Report on and commit to mitigating processes for physical climate risks;
- Introduce board-level oversight of sustainability risk management.
If the company has made no effort to improve after 2 years, we will take action to escalate, e.g. by voting against election of board member; and disposal of shares could commence if there is no significant progress after 4 years.
In addition, thermal-coal mining and power generation companies are subjected to accelerated engagement, companies who do not have coal exit plans by 2030 in OECD countries, and 2040 worldwide, will be flagged as presenting ESG risks to which material financial risks attach, and a recommendation will be made to the CIO to review the overall case for disposal. We do not have any significant exposure to Arctic drilling, fracking, oil sands, or shale, given the ESG financial risks that attach to these activities at present, and we do not foresee increasing our allocations to these industries going forward.
Apart from direct engagement and escalation, we also engage collaboratively through sign-on letters, and as member of Climate Action 100+.
Given our value-oriented investment style, the portfolio is naturally tilted towards carbon-intensive, hard to abate sectors such as materials (chemicals, steel, cement, aluminium), and transportation (aviation, shipping). Both the supply side of energy transition, and the demand side of adaptive innovations need to happen to reduce transition climate risks. While we have seen some rapid progress in developing low carbon technologies amongst our investees, policy advocacy will play a more important part in future, as government commitment and incentives are key to accelerate real-world transition.
4. Metrics and Targets
Disclose the metrics and targets used to assess and manage relevant climate-related risks and opportunities where such information is material
Financed emissions of all listed equities assets, versus the MSCI Emerging Markets Index (“Benchmark”), as of 31 Dec 2022, are as follows:
|
|
DISCLOSURE |
EMISSION EXPOSURE |
RELATIVE EMISSION EXPOSURE |
||
| Weights | tCO₂e | tCO₂e/Invested | tCO₂e/Revenue | ||
| Holdings | Scope 1 & 2 | Incl. Scope 3 | Relative Carbon Footprint | Weighted Avg Carbon Intensity | |
| Portfolio | 70.1% | 2,393,975 | 14,023,351 | 618.42 | 290.84 |
| Benchmark | 86.5% | 1,180,817 | 5,094,817 | 305.04 | 325.63 |
The scenario alignment analysis compares current and future portfolio greenhouse gas emissions with the carbon budgets for the IEA Sustainable Development Scenario (“SDS”), Announced Pledges Scenario (“APS”), and Stated Policies Scenario (“STEPS”). Performance is shown as the percentage of assigned budget used by the portfolio and benchmark.
Our total portfolio AUM has an implied temperature increase of 3.5°C, based on calculation using ISS estimates, whereas the Benchmark has a potential temperature increase of 3°C. Both are misaligned with a SDS scenario by 2050.
Emission contribution by sector can be broken down into:
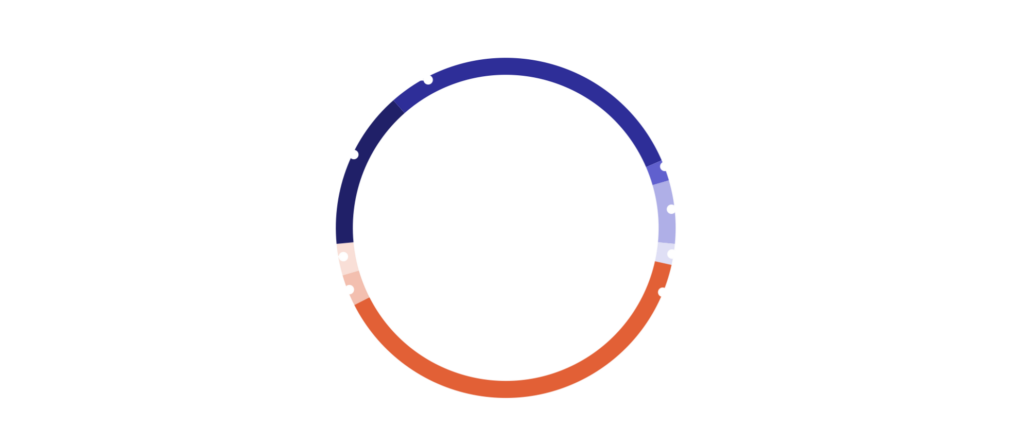
Figure 2: N.B. ISS estimates
Targets
As a small firm, we currently do not measure our operational carbon emissions. However, going forward the Firm intends to track operational carbon emissions where possible to establish sustainability targets. The Firm is also considering including sustainability-related targets in the remuneration of investment professionals, and Directors.
To increase the proportion of portfolio companies that are climate resilient and transition aligned, we will engage with companies to focus on setting interim carbon reduction targets.
There is a lack of long-term visibility and government commitment on climate policy and renewables investments in many emerging markets. As such we intend to be more active in policy engagement and standard setting going forward.
Appendix
Scope 1 & 2 emissions for companies
The emissions methodology was developed over three years with the Swiss Federal Institute of Technology and includes about 800 sector and sub-sector specific models, allowing ISS ESG’s researchers to calculate the GHG emissions of companies based on those criteria that are most relevant to their line of business.
The process is summarised as follows:
- Self-reported emissions data is collected from all available sources;
- Self-reported numbers are evaluated for trustworthiness and, where necessary, discarded;
- All companies are classified according to the proprietary ISS ESG CICS (Carbon Industry Classification System) – i.e. companies are classified in light of their carbon-profile, allowing ISS ESG to benchmark non-reporting companies against their reporting peers;
- ISS ESG applies its 800 sub-sector specific models to estimate the emissions of non-reporting companies according to sector-relevant financial or operational metrics.
Scope 3 emissions
ISS ESG’s methodology conceptually differentiates between two sources of Scope 3 emissions: a.) emissions from a company’s upstream and downstream supply chains and b.) emissions from the “use phase” of a company’s product or service.
Supply chain: For supply chain emissions, ISS ESG uses an Economic Input-Output Lifecycle Assessment table that models cash flows between sectors within an economy. The method uses information on industry transactions, such as the purchase of materials, to estimate total emissions throughout the supply chain.
Product use phase: The “use phase” GHG emissions of representative products per industry are calculated based on Life Cycle Assessments (LCA) available through the Swiss Centre for Life Cycle Inventories (Ecoinvent) and other databases. ISS ESG uses LCA for representative products of the sectors to estimate, on average, the ratio between Scope 1 & 2 / use phase per activity.
For most sectors, Scope 3 emissions are “sector representative” emissions and should not be used for stock picking. They can, however, be used for quantifying the order of magnitude of a full portfolio assessment. Thus, considering Scope 3 emissions allows investors to focus their efforts on those sectors where Scope 3 data matters most and that might fall under the radar screen when just looking at Scope 1 & 2 emissions.
Emission exposure – Calculated using the following formula for Scope 1 & 2. The same approach is used for calculating Scope 3 emissions:

Relative carbon footprint:
Weighted average carbon intensity:

Where, carbon intensity: